A question that I see asked in forums, slack channels, direct messages, etc, is why I see that access to storage was lost during events that are viewed as non-disruptive…since you know, lost access to volumes seems to be a disruptive event. By a non-disruptive event I am talking about an HBA SFP or cable replacement on the storage array or ESXi host, a FlashArray software upgrade, a FlashArray hardware upgrade or controller replacement, etc.
While I am going to focus on why these events could be reported during non-disruptive events, it’s important to keep in mind that these events can be a symptom of real issues in the environment if they are reported outside of planned actions. Such as issues in the SAN (slow drain, bad SFP, bad cable, a bad switch port, initiator HBA, target HBA…), HBA driver issues (fnic, nfnic, qla2xxx, lpfc), or any collection of unknown issues.
What I am trying to say is that not all cases of seeing this event in vCenter can just be ignored. If you know there is action being taken with the Storage Array, then you can quickly identify the root cause of the reported events.
The Quick and Dirty on ATS Heartbeating
Before digging into the event reporting, we should get a brief review on ATS Heartbeating. Now, my intent isn’t to do a deep dive into ATS Heartbeating, how it works or why it’s used. Rather I want to cover the basics of what it is and how it has anything to do with these lost access to volume events.
Let’s take a look at the VMFS volume partition first. Standard VMFS volume partitions are created when a VMFS datastore is created. One of these partitions is the Heartbeat Region, which as the name would imply, is the region that ATS is going to heartbeat to.
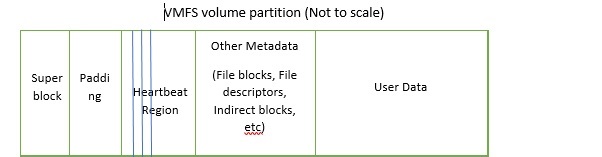
I could go into this more, but truthfully it’s outlined pretty well in VMware’s ATS Heartbeating KB. Every 3 seconds there is HB issued to check the liveliness of the VMFS Datastore. The HB IO timeout value is 8 seconds, so if a heartbeat doesn’t complete in that 8 second window the HB IO is timed out and an additional HB is issued. Once a HB IO hasn’t been successful for 16 seconds the “lost access to volume” event is issued and the datastore is marked offline until the HB is established again.
One thing I’ll mention before moving on though is that when we are looking at the vmkernel log later, we are going to be looking for the SCSI OP 0x89, which is a compare & write. This is the SCSI operation that is checking the heartbeat region and then updating it.
Lost Access to Volume is Reported
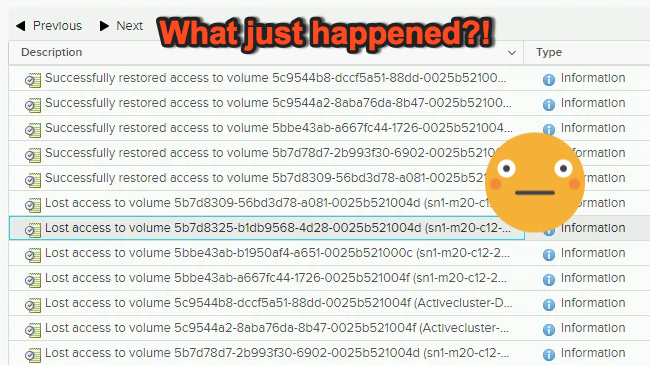
When an event causes one of these 0x89 (compare and write) operations to fail for 16 seconds, an event will appear in vCenter or which ever monitoring the end user has configured to pick up these events, that will say that the host has lost access to the volume/datastore.

In the example I’m showing the volume that reported the event that access was lost is sn1-m20-c12-25-Datastore-1-LUN-150. Whenever I dig into event’s such as these I like to get a good summary of the Datastore’s Name, UUID and the device ID. There are a couple ways to do this via esxcli. One was is with esxcli storage vmfs extent list and the other is with esxcfg-scsidevs -m. Both work and there are other ways that I can grab this information as well. These are just two examples.
[root@ESXi-1:~] esxcli storage vmfs extent list | grep "Name\|sn1-m20-c12-25-Datastore-1-LUN-150"
Volume Name                               VMFS UUID                            Extent Number  Device Name                           Partition
sn1-m20-c12-25-Datastore-1-LUN-150        5b7d8325-b1db9568-4d28-0025b521004d              0  naa.624a9370bd452205599f42910001edc8          1

[root@ESXi-1:~] esxcfg-scsidevs -m | grep "sn1-m20-c12-25-Datastore-1-LUN-150"
naa.624a9370bd452205599f42910001edc8:1                           /vmfs/devices/disks/naa.624a9370bd452205599f42910001edc8:1 5b7d8325-b1db9568-4d28-0025b521004d  0  sn1-m20-c12-25-Datastore-1-LUN-150
Now I know that for the Volume sn1-m20-c12-25-Datastore-1-LUN-150 the VMFS UUID is 5b7d8325-b1db9568-4d28-0025b521004d and the Device Name is naa.624a9370bd452205599f42910001edc8. This will help when digging through the vmkernel log and the hostd log for the log lines of interest.
In hostd.log the access to volume is lost event that corresponds to the event found in vCenter can be found. Here is the event that is related to the event found in vCenter for esxi-1 and datastore sn1-m20-c12-25-Datastore-1-LUN-150.
2019-05-22T20:56:21.606Z info hostd[2500559] [Originator@6876 sub=Vimsvc.ha-eventmgr] Event 4574 : Lost access to volume 5b7d8325-b1db9568-4d28-0025b521004d (sn1-m20-c12-25-Datastore-1-LUN-150) due to connectivity issues. Recovery attempt is in progress and outcome will be reported shortly.
The event is reported at 20:56:21.606Z in hostd, so we should see the 0x89 op fail shortly before that in vmkernel and then a few seconds after that we’ll likely see that there is a waiting task for the timed out HB.
2019-05-22T20:56:20.607Z cpu9:2097212)ScsiDeviceIO: 3449: Cmd(0x459b25edf740) 0x89, CmdSN 0x9dbf1e from world 2097193 to dev "naa.624a9370bd452205599f42910001edc8" failed H:0x5 D:0x0 P:0x0 Invalid sense data: 0x0 0x0 0x0.

2019-05-22T20:56:25.679Z cpu19:2100569)HBX: 3040: 'sn1-m20-c12-25-Datastore-1-LUN-150': HB at offset 3604480 - Waiting for timed out HB:
Sure enough, at 20:56:20 we can see the 0x89 failed. A quirky part here is that while the actual command failure and task abort that you find in vmkernel is often very close to when the event happens, the initial 8 second IO timeouts and 3 second periodic HBs are happening before that. The logging that we’ll likely first see is at the tail end of that 16 second timer. In this case we see the failed OP a second before the event is issued in hostd. Then we will continue to see that the messages waiting for the timed out HB.
Restored Access to Volume is Reported
In my example I happened to reboot the controller on my storage array, just wanted to make it simple. I could have just downed some switch ports as well, but during a Software upgrade on the FlashArray the controllers are rebooted. A controller firmware upgrade was often what triggered this even to appear and the end user to ask why.
Thankfully, there are two controllers and NMP should retry that HB IO down a live path and looking through vmkernel you will see that the path is updated and the HB will be reclaimed on the datastore.
2019-05-22T20:56:29.406Z cpu21:2097224)WARNING: NMP: nmp_DeviceRequestFastDeviceProbe:237: NMP device "naa.624a9370bd452205599f42910001edc8" state in doubt; requested fast path state update...

2019-05-22T20:56:29.416Z cpu0:3245359)HBX: 312: 'sn1-m20-c12-25-Datastore-1-LUN-150': HB at offset 3604480 - Reclaimed heartbeat [Timeout]:
There we go, HB was reclaimed and in hostd we can see that the access to the volume for that datastore was restored.
2019-05-22T20:56:29.417Z info hostd[2099292] [Originator@6876 sub=Vimsvc.ha-eventmgr] Event 4583 : Successfully restored access to volume 5b7d8325-b1db9568-4d28-0025b521004d (sn1-m20-c12-25-Datastore-1-LUN-150) following connectivity issues.
Then in vCenter UI we can see that the even that access was restored is there.

The time that the lost access to volume event was reported was 20:56:21 and access to the volume was restored at 20:56:29. Meaning it took about 8 seconds for the HB to be reclaimed and for access to the volume to be restored. I would not recommend ignoring this messages and events, they can be very useful when root causing events and help build out a solid timeline of the events that you are troubleshooting as well. However, in and of themselves, these events are not a root cause or indicate a sev1 or outage occurred.
References and Fun Reads
You might ask yourself, “where can I find some great posts or KBs that cover some of this?” Well, you are in luck, I’m going to add in some blog posts and KBs that I’ve found helpful when learning about ATS heartbeating, the lost access to volumes events, and some other examples of seeing it.
Hello,
So having only 1 path down can cause those messages, even if the rest of the paths are up ?
Meaning that the heartbeat was using the specific path where the heartbeat was going through.
The time of failover from 1 path to another is then 16s ? Or it could be tuned ?
Thanks
This could have to do with the pathing policy as well. The default SATP rule is likely going to be using MRU (most recently used) pathing policy for new devices, which only uses one of the available paths. Ideally they would be using Round Robin, which has an IOPs limit setting. That setting is 1000 by default I believe (would need to double check that), meaning that it sends 1000 IOPs down path 1, then 1000 IOPs down path 2, etc. That’s why the pathing policy could be at play.
To your question, having one path down is causing this logging to occur. Yes, it’s total possible if that path that went down is using MRU or RR with an IOPs limit of 1000, that when it goes down you’ll hit that 16 second HB timeout before nmp switches over to the next path.